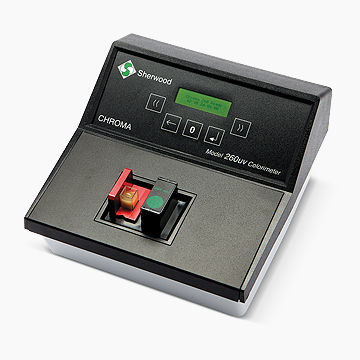
Model 260UV Programmable Colorimeter (Discontinued – October 2022)
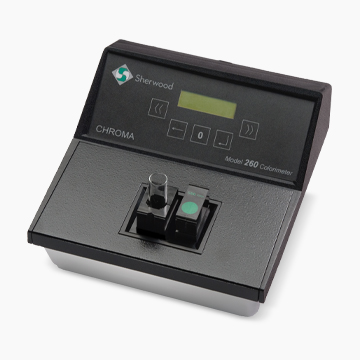
Model 260 Programmable Colorimeter (Discontinued Jan 2022)
Product Overview
The ability to analyse and quantify colour in aqueous solutions and liquids using a colorimeter is something today’s analyst takes for granted. As a result, some of the fundamental principles of this routine technique are forgotten or overlooked when new analysts come in contact with the technique for the first time. In addition even experienced users may not always appreciate the power and versatility of the technique if they have always used it for the same routine tests; day in day out.
For an introduction to the technique, the practical aspects of the instrumentation and to illustrate just how versatile today’s colorimeters can be, see:
In 2006 the Model 260 replaced the old Chroma 254 & 257 series of CHROMA Colorimeters, developed by Corning, and used extensively worldwide in a wide variety of QA/QC and Clinical Chemistry Laboratories. The optical bench, tried and tested over 35 years, remains the same. To that stable foundation the Model 260 instruments add programmability, and a broader range of functionalities, through use of on-board microprocessor and firmware advances. Up to 100 methods may be programmed and stored by the operator allowing utilisation of most commercially available test kits and user generated reagents. The Model 260 unit allows quick, simple, Absorbance and %Transmission measurements together with more complex Auto-zero, Concentration with Standard Solutions or Factors as well as Kinetic Reaction (Rate and End Point) Methods.
In 2012 the Model 260UV was introduced; with a Halogen light source and detector allowing operation down to 325nm and also a heated cuvette holder; thermostated to maintain sample temperatures at 37°C. These features allow a number of enzyme based diagnostic tests to be performed with an accuracy that matches higher priced analysers and spectrophotometers.
Accessories

Sample containers
Colorimetric analysis is performed on solutions and as such the sample can only be analysed within a container. The container must therefore be (or made to be) transparent at the wavelength at which the sample is being measured. Sample containers are offered in a variety of forms depending on whether the important factor is sample size, speed of measurement or accuracy. For colorimetric work all containers should be made of glass or clear plastic. The types of container are listed below.
Matched Test Tubes
These are made of soda glass. They are individually matched at the Sherwood factory and supplied in matched sets, i.e. each tube in any set has exactly the same absorbance characteristics. This ensures that once a blank has been measured every sample absorbance readout will be due to the sample only no matter which of the tubes in the set is used.
Various diameter tubes are offered so that the sensitivity of measurement can be varied i.e. if a sample is concentrated (high absorbance values) then measurement in a small test tube is suitable as the light has to travel a smaller distance through the sample leading to lower absorbance values. However, if dilute samples are to be analysed it is necessary to increase sensitivity by offering more sample to the light hence larger test tubes are used.
Each test tube size has a corresponding holder. The holders can also accommodate a square cuvette of the appropriate size; 10mm, 5mm and 2.5mm
| Test Tube Part No Set of 12 | Diameter | Holder Part No |
| 00299011 | 15 mm | 25212001 |
| 00299012 | 10 mm | 25211001 |
| 00299013 | 5 mm | 25210001 |
Cuvettes
Sherwood Scientific supplies these in several versions:
General purpose Plastic (Polystyrene) 10 x 10 x 45 mm. (471 88 300)
Supplied with every Model 260 (not UV) CHROMA Colorimeter. Beware of reusing disposable cuvettes which can become scratched and unusable. They should not be used for any measurement involving light scattering such as Sperm counting as the slightest surface imperfection will ruin the precision of the measurement.
Semi micro version Plastic 10 x 4 x 10 mm (471 88 400)
Also made of polystyrene these are used where the volume of sample is restricted, for example, with biological samples. The path length is still 10 mm and can work with sample volumes down to 600µl.
Micro Cuvettes (001 26 120)
For use with Heated Cuvette Holder they are UV compatible and have a path length of 10mm but can operate with sample volumes down to 400µl.
Glass Cuvettes
These are basically fused glass cells with an exact path length (usually 10 mm). Glass Cuvettes generally offer reusability provided they are handled carefully and cleaned well.
The most common colorimetric measurements are made in 10 mm x 10 mm cuvettes. These cuvettes are usually 45 mm high and hold 4 ml of sample solution.
Optical Filters
Polyester Filters (Replacement for discontinued Gelatin Filters)
These are low cost selection devices which produce or transmit a wide band of radiation usually 20 nm. Fortunately, most colorimetric analyses have a wide absorption band which allows excellent results to be obtained in conjunction with the CHROMA colorimeters.
Coverage of all wavelengths in the visible spectrum is catered for using a set of 8 Polyester filters (252 27 039). However, most colorimeters are used for only one type of analysis and therefore use only one filter.
Interference Filters
These are used to select wavelengths more accurately by providing a narrow bandpass typically of around 10nm. The Interference Filter also only absorbs approximately 10% of the incident radiation over the whole spectrum thereby allowing light of higher intensity to reach the detector.
Sherwood supplies a range of Interference Filters and, in principle, any wavelength can be accommodated.
Filter type Peak wavelength nm Bandpass Part number
Set Polyester filters 430-710 ± 20 nm 25227039
Polyester 410 ± 20 nm 25227030
Polyester 430 ± 20 nm 25227031
Polyester 470 ± 20 nm 25227032
Polyester 490 ± 20 nm 25227033
Polyester 520 ± 20 nm 25227034
Polyester 540 ± 20 nm 25227035
Polyester 580 ± 20 nm 25227036
Polyester 600 ± 20 nm 25227037
Polyester 710 ± 20 nm 25227038
Interference 340 ± 5nm 25227021
Interference 405 ± 5nm 47188900
Interference 420 ± 5nm 25227022
Interference 510 ± 5nm 47189000
Interference 546 ± 5nm 47189100
Interference 600 ± 5nm 47189150
Interference 636 ± 5nm 47189155
Interference 660 ± 5nm 47189200
Interference 670 ± 5nm 47189250
Interference 680 ± 5nm 47189300
FAQs
-
I have two Model 254 colorimeters and when I put the same solution in each, even after blanking, why do I get different results?
This is because each instrument and particularly each filter have slight differences in the way they pass the light through . You must therefore, for quantitative work , not only blank the colorimeter, but a standard of known concentration must be measured and the absorbance of the unknown sample be measured and compared with that of the standard.
(When blanking (zeroing), the cuvette ,which will be used for measuring the standard and samples, should be filled with the solvent (usually water) that is to be used for the sample and standards (including all other reagents except the sample and standard substance). The cuvette is placed in the cuvette holder and the absorbance is set to 0.00 (0.000 for the Model 257) by adjusting the coarse and fine controls.
-
How do I choose the correct wavelength filter for my measurement.
If you are using a commercial kit of chemicals to perform an assay the kit manufacturer will give the wavelength in the kit “insert” or instructions.
If you are developing a new method and want to measure the concentration of a substance only at one wavelength then perform a spectral scan of the substance under investigation on a spectrophotometer to determine the wavelength of maximum absorbance. Determine how broad the wavelength peak is at half peak height. If it is less than 10nm then choose an interference filter with the wavelength the same as the peak. If it is > 20nm then you could choose a gelatin filter with a wavelength within 10nm of the peak wavelength. If you have no spectrophotometer available then choose a filter of complementary wavelength.
-
How long does a bulb last
About 1000 hrs.
-
Theory of Colorimetry
UNDERSTANDING LIGHT AND COLOUR
Before we can discuss the technique of colorimetry it is important to understand and to differentiate this technique and others which involve measuring electromagnetic radiation from various parts of the spectrum.The following table should clarify the types of radiation that constitute the electromagnetic spectrum. For those who are unfamiliar with the definition of wavelength and its units here is a brief guide:
Radiation may be considered as a wave. The wavelength is the distance between two successive peaks of that wave.

The wavelengths in the table are expressed in nanometers (nm) these are related to metres thus:
1 nanometer = 10-9 metre

Colorimetry is just one of the types of photometric analysis techniques i.e. it is a light measuring analytical procedure. Colorimetric measurements are made using a white light source which is passed through a colour filter or alternative wavelength selection device. This incident light then passes through a cuvette containing a chemical compound in solution. The intensity of the light leaving the sample will be less than the light entering the cuvette. The loss of light or absorption is proportional to the concentration of the compound.Colorimetry however only applies to measurements made in the visible region of the electromagnetic spectrum e.g. (380 – 780 nm). The extent to which light is absorbed by a sample is dependant upon many factors. The main general contributors are the wavelength of the incident light and the colour of the solution.
Each compound in solution has a typical (and usually unique) absorption spectrum, an example is shown in fig. 4.

The spectrum is a pattern of the amount of light absorbed by the substance in the solution plotted against the wavelength of the light. In most cases the spectrum will have a peak i.e. a wavelength at which absorption is at a maximum. This is often referred to as the max for the compound in question. If the absorption is being quantified it is essential that it is measured as close as possible to the max. Sensitivity is reduced at any other wavelength. From the example our sample has a max at about 460 nm in the blue part of the spectrum. So what colour will it appear to be? Well the answer is yellow!
Confused? Well here is the explanation:
Inert materials whether solid or liquid appear coloured due to the way they modify light illuminating the object. Thus different objects absorb some wavelengths and reflect others. If white light passes through a yellow solution, it absorbs all colours except yellow. Similarly, a book cover appears red since it absorbs all colours except red.
If a solution is clear and colourless it has not absorbed any visible radiation and therefore all the white light is transmitted ie. it is transparent.
See the example of the spectral distribution curve solution in figure 5. The solution absorbs blue light strong a max at 460nm and therefore appears yellow.

If the concentration of the yellow solution is reduced by half the two solutions will give curves shown. Therefore for greatest sensitivity and linearity it is essential to limit the measuring wavelength to the area of highest absorption. Figure 5 shows that the correct wavelength at which to measure a solution is the one which gives greatest absorption.
The wavelength or colour filter that will produce the maximum absorbance can be selected in two ways:
- Take readings throughout the spectrum on a typical standard solution of the substance under investigation and establish the peak wavelength
- Choose a filter of the complementary colour to the standard solution. Figure 6 shows basic relationship between colours

WAVELENGTH SELECTION
There are several options open to the manufacturer of a colorimeter when deciding how to select the wavelength i.e. produce monchromatic radiation (one wavelength band) from polychromatic radiation (white light). These basic options are-
- Gelatin filters (now replaced by Polyester filters)
- Interference filters
- Grating monochromators
- Prisms
Gelatin Filters (now replaced by Polyester filters) These are low cost selection devices which produce or transmit a wide band of radiation usually ą 20 nm. Fortunately most colorimetric analyses have a wide absorption band which allows excellent results to be obtained from a simple colorimeter. The most common type of gelatin filter is constructed by sandwiching a thin layer of dyed gelatin of the desired colour between two thin glass plates (polyester filters are sheets of polyester with carefully selected coloured saying material incorporates within the sheet).
There are two drawbacks which can be encountered using gelatin/polyester filters:
- 1.They have a wide bandpass, see Fig 15, which can lead to non linearity in standard curves

- 2. They absorb approximately 30-40% of all incident radiation thereby reducing energy throughput to the detector.
However these filters are eminently suitable for most general applications.(Glass Filters Coloured glass filters are now more or less historical selection devices in colorimeters and have very wide bandposses often up to 150nm. Specific wavelengths can however be achieved by using a combination of glass filters.)
To ensure all wavelengths in the visible spectrum are catered for, approximately 8 Gelatine or Polyester filters are required.
Interference Filters
These are used to select wavelengths more accurately by providing a narrow bandpass typically of around 10nm. The interference filter also only absorbs approximately 10% of the incident radiation over the whole spectrum thereby allowing light of higher intensity to reach the detector.
The theory of operation of an interference filter is fairly complicated but has been simplified below.
An interference filter comprises of several highly reflecting but partially transmitting films of silver separated by thin layers of transparent dielectric material (often magnesium fluoride (MgF2) This is also referred to as an MD or metallic dielectric filter). When white (polychromatic) light passes through the dielectric layers multiple reflections appear between the semi-transparent mirrors. However some energy from the light beams passes straight through the filter. It is this wavelength which is desired for analysis. If the dielectric layer thickness is altered slightly the resultant wavelength is changed.
QUANTITATIVE MEASUREMENTS
Before the analyst attempts to perform quantitative colorimetric analysis it is important to understand the theoretical aspects of the technique. The relationship between concentration and the light absorbed is the basis of the following theoretical consideration; The seemingly obvious way of taking readings on a colorimeter is to measure % transmission and adjust the ‘blank” to 100%.
For example, consider a situation where a blank is measured followed by three standard solutions having concentrations of 1, 2 and 3 units respectively. Ideally, a colorimeter should be giving concentration readings directly, but consider the above solutions when analysed.
The solution with a concentration of 1 unit reduces the light to 50% therefore, the solution with a concentration of 2 units will reduce the light to 25% and the solution with a concentration of 3 units will reduce the light to 12.5%.Therefore if the colorimeter is calibrated using a transmission scale, the following graph is produced.

The calibration in %T has the drawbacks of being non- linear and readings decreasing with increasing concentration. Bonguer first investigated this type of relationship for changes in thickness of solid materials. His work was followed by Lambert and Beer in 1852, who extended the studies to solutions. All three investigators contributed what is universally known as The Beer Lambert Law.
This states that:
The light transmitted through a solution changes in an inverse logarithmic relationship to the sample concentration.In order to take measurements both directly and linearly in terms of concentration, %T readings must be converted into an inverse logarithmic form which are called optical density units (OD) or absorbance (A).
The formula is: = OD = log10100/%T
Therefore, for the given example, the relationship of OD to concentration is shown in the table below.
Concentration %T OD 0 100 0 1 50 0.3 2 25 0.6 3 12.5 0.9 A calibration curve of OD against concentration linear and directly proportional.

Optical density (absorbance) is used for colorimetric analysis so that readings relate directly to concentration.
Similarly, optical density changes directly with sample path length. Thus we arrive at.
Abs = E x c x l
Abs = Absorbance
E = Extinction coefficient or molar absorptivity
c = Concentration
l = Path lengthl is fixed by the pathlength of the cuvette (usually 10mm) and E is a constant for each chemical species hence Abs